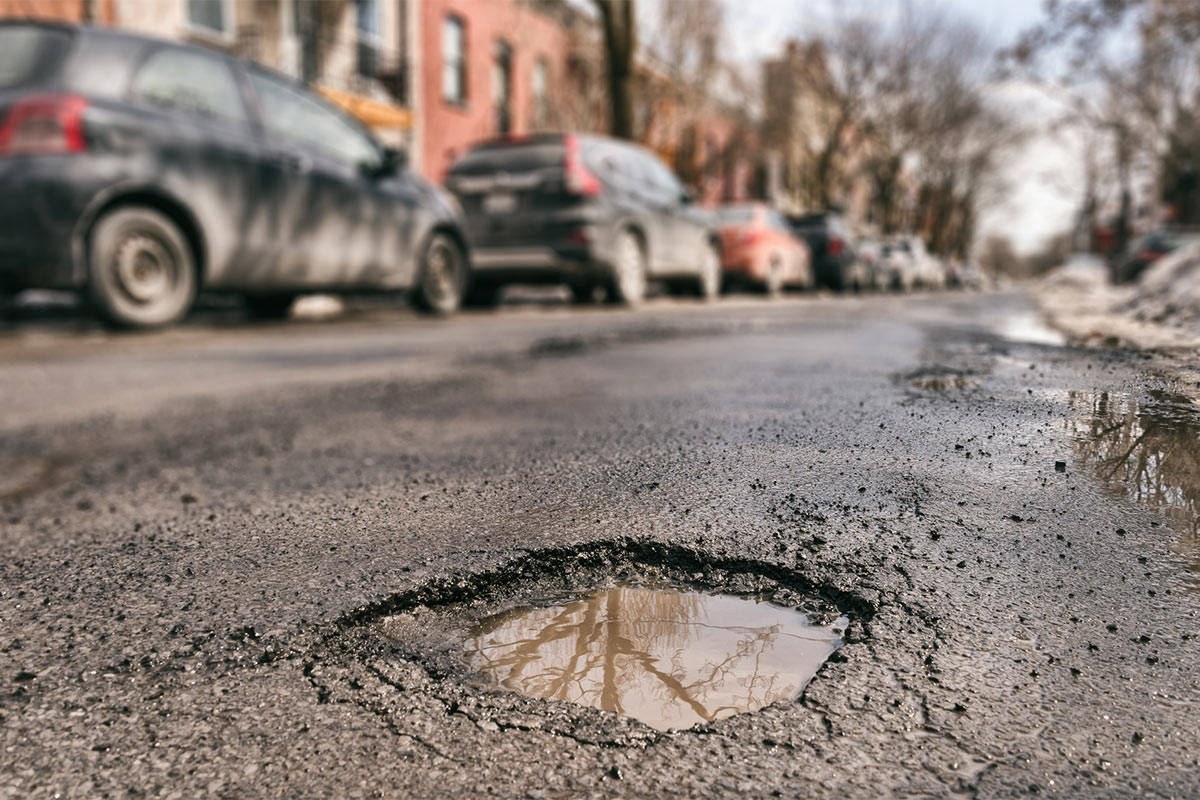
When was the last time you took a drive from A to B across the UK and did not encounter at least one pothole? Possibly too long to remember.
It’s an issue that government knows exists. In fact, they have put plans in place to try and reduce the number of these road defects significantly. Chancellor Philip Hammond announced during the 2018 Budget that local councils will be allocated £420 million during this financial year so that they can attempt to fix potholes in their constituency — this is on top of an existing fund that is made up of close to £300 million.
After Mr Hammond made his announcement, Hannah Maundrell, the Editor in Chief at money.co.uk, pointed out: “£420 million to tackle potholes might seem like throwing big money at a relatively minor issue. But it’s a common problem for many drivers who have to fork out cash because their cars are damaged by poor roads.
“This will be welcome news too for insurance companies who foot a large chunk of the bill.”
Is it about time that potholes are no longer seen as just being a minor issue in the UK, but a bit more of a major problem? Also, just how far will the funds go to solving the problem? After all, the Asphalt Industry Alliance’s chairman Rick Green pointed out in March following a local authority survey that “more than £8 billion would be needed to carry out a one-time catch up to bring local roads in England up to scratch”.
Trying to answer these questions is Vindis, which provides Audi servicing and is also the place to book plans from various other brands to ensure your vehicle always remains in a perfect driving condition. They’ve taken the time to look at the scale of the UK’s problem with potholes at the moment…
Pinpointing the UK’s hotspots for potholes
FillThatHole.org.uk’s league table makes for interesting viewing. This is because it sees highway authorities ranked according to the number of road hazards which have been reported to them. Here’s a look at the top ten places currently in this table, as well as how the stats have changed since the summer of 2017…
| Position | Authority | Region | Total reports | Open reports | Fixed reports | Percentage fixed |
| 1
(= to 2017) |
Surrey | South East England | 8,732
(up 14.04% from 2017) |
7,455
(up 15.17% from 2017) |
1,240
(up 7.92% from 2017) |
14%
(down 1 percentage point from 2017) |
| 2
(= to 2017) |
Hampshire | South East England | 4,712
(up 14.01% from 2017) |
3,759
(up 15.98% from 2017) |
906
(up 6.71% from 2017) |
19%
(down 2 percentage points from 2017) |
| 3
(= to 2017) |
Essex | South East England | 4,130
(up 8.57% from 2017) |
3,209
(up 10.2% from 2017) |
906
(up 3.19% from 2017) |
22%
(down 1 percentage point from 2017) |
| 4
(= to 2017) |
Hertfordshire | South East England | 4,052
(up 13.92% from 2017) |
3,423
(up 13.95% from 2017) |
604
(up 13.96% from 2017) |
15%
(equal to 2017) |
| 5
(up 1 place from 2017) |
Lancashire | North West England | 3,972
(up 20.33% from 2017) |
3,080
(up 23.99% from 2017) |
867
(up 9.47% from 2017) |
22%
(down 2 percentage points from 2017) |
| 6
(down 1 place from 2017) |
Kent | South East England | 3,857
(up 10.9% from 2017) |
3,472
(up 11.82% from 2017) |
376
(up 3.3% from 2017) |
10%
(equal to 2017) |
| 7
(= to 2017) |
Oxfordshire | South East England | 3,663
(up 12.88% from 2017) |
2,618
(up 17.66% from 2017) |
1,009
(up 2.44% from 2017) |
28%
(down 3 percentage points from 2017) |
| 8
(up 1 place from 2017) |
Cheshire East | North West England | 3,452
(up 15.84% from 2017) |
2,556
(up 21.14% from 2017) |
813
(up 3.3% from 2017) |
24%
(down 3 percentage points from 2017) |
| 9
(down 1 place from 2017) |
Glasgow | Scotland | 3,203
(up 4.71% from 2017) |
2,564
(up 4.91% from 2017) |
625
(up 3.99% from 2017) |
20%
(equal to 2017) |
| 10
(no data for 2017) |
Buckinghamshire | South East England | 3,135
(up 13.83% from 2017) |
2,741
(up 14.26% from 2017) |
382
(up 11.37% from 2017) |
12%
(down 1 percentage point from 2017) |
From these facts and figures, it’s clear that those who are looking for a solution to the UK’s pothole problem is facing a huge headache. We can see from the figures that all of the ten authorities covered have increased the number of potholes that they have fixed, for instance. However, the number of potholes that have been reported has also increased in each authority. This indicates that there are more new potholes appearing than those tasked with repairing them can keep up with.
Focusing on the information recorded in relation to Lancashire, in the North West of England, puts this issue into context to make it even more clear to understand. The number of fixed pothole reports in that area was up 9.47 per cent when compared to the summer of 2017’s figures. While this should be good news, it’s countered by the fact that the total reports in the region increased by 20.33 per cent and the number of open reports was up 23.99 per cent over this same period. Despite their efforts then, Lancashire has actually moved further up FillThatHole.org.uk’s league table!
As a result, a large effort is going to be needed to get rid of every pothole that’s appeared throughout the UK. It remains to be seen just how far the £420 million that has been provided from the 2018 Budget will go to solve the crisis on the nation’s road network, but hopefully it’ll be a step in the right direction.
Sources:
https://www.express.co.uk/news/politics/1037920/budget-2018-uk-news-update-potholes-roads
https://www.bbc.co.uk/news/business-46007351
https://www.fillthathole.org.uk/league-table?sort=desc&order=Total+Reports

